Every domain follows the same path: registration, active use, expiration, and deletion. This report covers April 2026 across the full lifecycle, drawing on ABTdomain’s daily snapshots of 1,000+ gTLDs. All metrics in this report are derived from daily observations aggregated over the month. Country-code TLDs are not included in Sections 1-4. Sales data (Section 5) covers all TLDs, including notable ccTLDs such as .ai. All figures reflect what our specific data sources observed and may not represent the complete market. For methodology details and data limitations, see the notes at the end of this report.
1. New Registrations
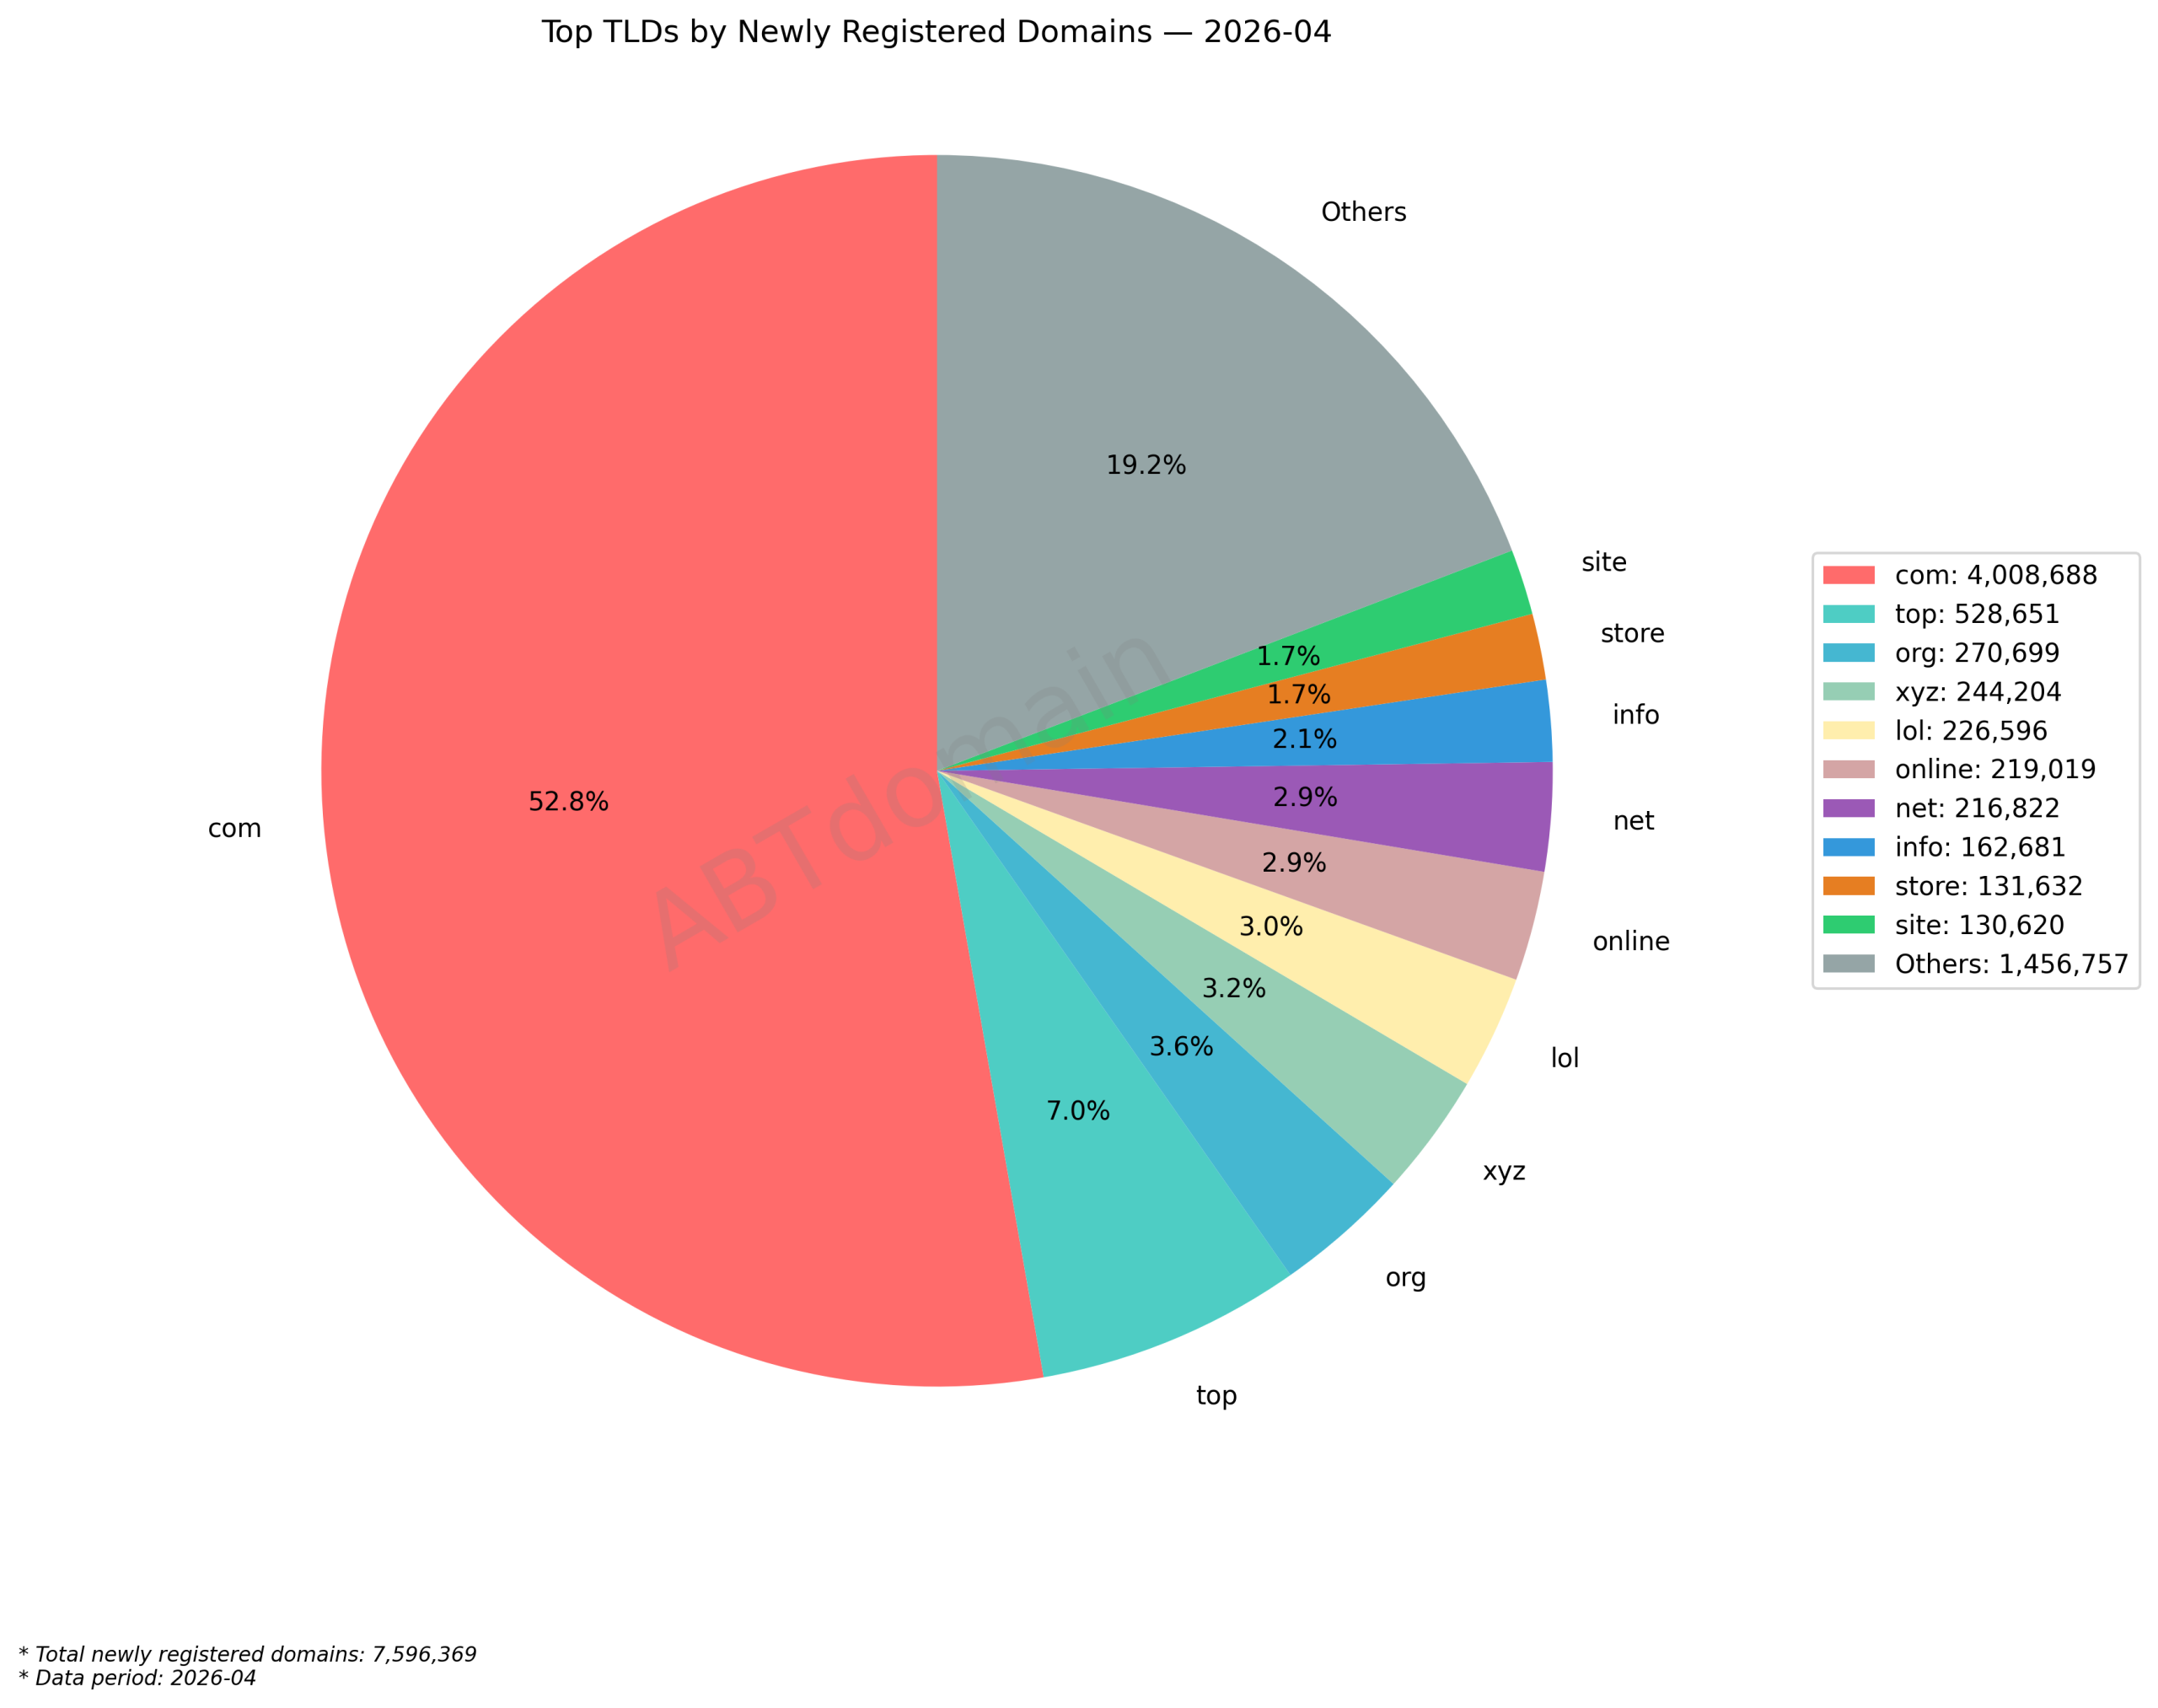
7,596,369 newly registered domains were found in April 2026, averaging 253,212 per day. This represents a 2.7% decrease from March’s 7,804,416. .com captured 52.77% of gTLD registrations, followed by .top (6.96%) and .org (3.56%).
TLD Distribution
| TLD | Registrations | gTLD Share |
|---|---|---|
| .com | 4,008,688 | 52.77% |
| .top | 528,651 | 6.96% |
| .org | 270,699 | 3.56% |
| .xyz | 244,204 | 3.21% |
| .lol | 226,596 | 2.98% |
| .online | 219,019 | 2.88% |
| .net | 216,822 | 2.85% |
| .info | 162,681 | 2.14% |
| .store | 131,632 | 1.73% |
| .site | 130,620 | 1.72% |
Notable shifts from March: .top rose from 5.29% to 6.96% share (up roughly 116,000 registrations), making it a firm second place. The .lol extension dropped from 4th (3.37%) to 5th (2.98%), while .info fell from 2.85% to 2.14% as its registration volume declined. The .com share held steady at around 52.8%.
Top Registrars
| Registrar | Registrations | Share |
|---|---|---|
| GoDaddy | 1,174,800 | 15.47% |
| Namecheap | 956,165 | 12.59% |
| Dynadot | 519,292 | 6.84% |
| Spaceship | 450,868 | 5.94% |
| Hostinger | 369,952 | 4.87% |
GoDaddy extended its lead from 13.89% to 15.47% month over month. Hostinger replaced GMO Internet in the top five. For daily registration data by TLD, visit DomainKits New Domains.
Registration Profile by TLD
| Metric | .com | .org | .top | .app | .dev |
|---|---|---|---|---|---|
| Registrations | 4,008,688 | 270,699 | 528,651 | 75,786 | 26,751 |
| Avg. SLD Length | 12.4 | 12.5 | 7.2 | 8.5 | 8.6 |
| Pure Letters | 75.6% | 79.6% | 20.9% | 83.1% | 89.4% |
| 1-Year Term | 90.6% | 92.2% | 99.3% | 94.8% | 93.4% |
| For-Sale | 1.8% | 1.26% | 0.01% | 0.73% | 1.05% |
| Cloud/Modern Tech Stack** | 23.63% | 24.19% | 14.21% | 33.59% | 50.27% |
Using .com and .org as baselines for an open, multi-party registration market: both show long SLD names (12+ characters), high pure-letter ratios (76-80%), moderate 1-year term rates (90-92%), and balanced cloud/tech-stack signals around 24%. This is the typical profile of a mature, broadly adopted TLD.
Compared to this baseline, .top diverges sharply: 7.2-character average SLD length, only 20.9% pure letters, 99.3% single-year terms, and 0.01% for-sale. Notably, .top’s registrar distribution is not concentrated in obscure providers: GoDaddy (~34%), Namesilo (13.4%), Dynadot (11.3%), and Spaceship (9.7%) are the same mainstream registrars that dominate overall gTLD registrations. The cause of the divergent registration profile is not identifiable from the data available.
.dev and .app show the opposite pattern: pure-letter ratios above the .com baseline (89.4% and 83.1%), and the highest cloud/tech-stack rates in the table (50.27% and 33.59%). This does not mean these TLDs are inherently “better.” The registrants who choose developer-oriented extensions are self-selected: they are more likely to use site-builder infrastructure (Cloudflare, AWS, Vercel) because that is the population these TLDs attract. The high cloud/tech-stack rate reflects registrant composition, not TLD quality.
Hot Registration Keywords
The following keywords appeared most frequently in newly registered domain names during April, based on ABTdomain’s tracking of newly registered domains across the month.
| Keyword | Registrations | .com % | Cloud/Tech Stack % | For-Sale % |
|---|---|---|---|---|
| ai | 49,427 | 65.1% | 19.4% | 4.3% |
| my | 40,972 | 61.4% | 20.2% | 1.8% |
| hub | 33,698 | 50.8% | 28.5% | 1.2% |
| group | 33,284 | 73.1% | 16.4% | 1.8% |
| pro | 32,274 | 60.8% | 25.3% | 1.5% |
“ai” remains the top registration keyword with 49,427 domains containing the term: 65% in .com, broad registrar distribution (GoDaddy 18.1%, Namecheap 14.7%, Cloudflare 6.7%), and 19.4% active usage. “hub” has the highest cloud/tech-stack rate (28.5%) among the top five. “group” shows the strongest .com concentration (73.1%). For keyword monitoring tools, visit DomainKits Keyword Search.
2. Active Domain Pool
The active pool grew from 243.2 million to 244.9 million domains in April, a net gain of +1,665,026 (+0.68%). While still positive, this is a deceleration from March’s +2,073,371 (+0.86%).
| TLD | Start | End | Change | % |
|---|---|---|---|---|
| Total | 243,185,682 | 244,850,708 | +1,665,026 | +0.68% |
| .com | 161,128,411 | 161,935,002 | +806,591 | +0.50% |
| .top | 6,083,014 | 6,299,447 | +216,433 | +3.56% |
| .org | 11,745,061 | 11,817,837 | +72,776 | +0.62% |
| .app | 1,162,936 | 1,219,963 | +57,027 | +4.90% |
| .dev | 625,916 | 645,956 | +20,040 | +3.20% |
| .net | 12,192,059 | 12,205,093 | +13,034 | +0.11% |
| .bot | 20,453 | 21,283 | +830 | +4.06% |
| .xyz | 8,085,395 | 7,948,829 | -136,566 | -1.69% |
Among smaller TLDs, .app (+4.90%), .bot (+4.06%), and .dev (+3.20%) all outpaced the overall pool growth. The .top extension gained 216,433 active domains (+3.56%), the second-largest absolute gain after .com. Explore active domain counts and TLD rankings on ABTdomain TLDs Reports.
3. Non-Active Domains
Roughly 6.77 million domains were non-active* in April, up from approximately 6.49 million in March (+4.3%).
| TLD | Non-Active | Share |
|---|---|---|
| .com | 3,588,364 | 53.0% |
| .xyz | 395,656 | 5.8% |
| .top | 311,259 | 4.6% |
| .net | 229,971 | 3.4% |
| .shop | 224,584 | 3.3% |
.com accounts for 53% of non-active domains, roughly in line with its 52.8% registration share. .xyz is disproportionately represented at 5.8% of non-active versus 3.2% of new registrations. .shop (3.3%) also appears at a rate above its 1.73% registration share.
4. Pending Delete
Roughly 5.13 million unique domains entered pending delete status between April 1 and April 30. Each domain is counted only once regardless of how many days it appeared in this status during the month.
| TLD | Pending Delete | Share |
|---|---|---|
| .com | 3,245,815 | 63.28% |
| .xyz | 368,032 | 7.18% |
| .top | 232,602 | 4.53% |
| .net | 208,493 | 4.06% |
| .online | 145,397 | 2.83% |
.com’s share of pending deletes (63.3%) is notably higher than its registration share (52.8%). .xyz again appears disproportionately at 7.2%, more than double its 3.2% registration share. Note that pending delete is a lagging indicator: domains entering this status in April typically expired 30 to 75 days earlier, so these figures reflect retention decisions made in January and February.
Of the 3.25 million .com domains that entered pending delete in April, roughly 470,000 (about 14.5%) had been re-registered as of early May. Track upcoming pending delete domains on DomainKits.
5. Premium Domain Changes, Sales & Keywords
ABTdomain monitors premium .com domains for status changes including expiration, nameserver changes, registrar transfers, renewals, and backorder captures. Below is the April 2026 summary, followed by secondary market sales and registration keyword trends.
3-Character .com Activity
1,463 monitored 3-character .com domains showed 1,601 change events in April. Renewals led (608), followed by nameserver changes (528), transfers (327), status changes (88), and expirations (44).
| Event Type | Count |
|---|---|
| Renewed | 608 |
| Nameserver Change | 528 |
| Transfer | 327 |
| Status Change | 88 |
| Expired | 44 |
| Other | 6 |
Notable 3-character .com events in April:
| Domain | Date | Event | Details |
|---|---|---|---|
| tgh.com | Apr 29 | Backorder | 26-year-old domain (reg. 1998) caught by Dynadot after drop |
| fbc.com | Apr 7 | Transfer | Key-Systems to MarkMonitor (brand protection registrar) |
| nas.com | Apr 6 | Status | Pending transfer initiated at Alibaba Cloud |
| use.com | Apr 14 | NS Change | Cloudflare to Atom.com (now listed for sale) |
| boy.com | Apr 5 | NS Change | Afternic to Atom.com (switched sale platform) |
| shh.com | Apr 28 | Transfer | NameCheap to Spaceship, now on Cloudflare (now on Cloudflare) |
The most significant 3-character .com event was fbc.com transferring to MarkMonitor, a registrar used by major corporations for brand protection. use.com (registered 1992) is now listed for sale on the Atom.com marketplace, a rare dictionary-word 3-character .com. nas.com initiated a transfer at Alibaba Cloud and later sold for $1.25M (see Sales below). Browse all premium domain changes with a free DomainKits account.
Notable Keyword Domain Activity
Among 146,367 unique 5+ character premium .com domains with 152,615 change events, several high-value dictionary-word and keyword domains showed significant movement:
| Domain | Date | Event | Details |
|---|---|---|---|
| share.com | Apr 29 | Transfer | Amazon Registrar to GoDaddy, moved off AWS DNS |
| down.com | Apr 1 | NS Change | Cloudflare to Afternic (now listed for sale) |
| vote.com | Apr 16 | NS Change | Moniker DNS to Cloudflare |
| alive.com | Apr 17 | NS Change | GoDaddy default to Cloudflare |
| phase.com | Apr 13 | NS Change | GoDaddy to Afternic (now listed for sale) |
| metrobank.com | Apr 15 | NS Change | ParkingCrew to Google Cloud DNS (now on active infrastructure) |
| prize.com | Apr 1 | Renewed | Extended to 2036 (9-year renewal) |
share.com (registered 1994) transferred from Amazon Registrar to GoDaddy and moved off AWS DNS. down.com and phase.com are now listed for sale on Afternic. vote.com, alive.com, and metrobank.com are now using hosting-oriented DNS providers (Cloudflare, Google Cloud DNS). prize.com‘s 9-year renewal to 2036 was the longest extension observed this month.
Premium Expiration Events
11,772 monitored premium domains expired during April, down from 13,793 in March. 3,400 previously expired domains were re-registered or caught by backorder services.
6. Global Secondary Market Highlights
This section covers publicly reported domain sales across all TLDs, including ccTLDs such as .ai. Unlike Sections 1-4 (which track gTLD zone files and WHOIS data), secondary market transactions reflect global trading activity and are not limited to the report’s base dataset.
The following are notable domain sales publicly reported in April 2026.
| # | Domain | Price | Platform | Date |
|---|---|---|---|---|
| 1 | Nas.com | $1,250,000 | Lumis | Apr 17 |
| 2 | 420.com | $500,000 | Private | Apr 21 |
| 3 | genesis.ai | $400,000 | Atom | Apr 9 |
| 4 | Free.ai | $350,000 | Atom | Apr 2 |
| 5 | SuperApp.com | $200,000 | Sedo | Apr 21 |
Nas.com sold for $1.25M via Lumis, which ABTdomain’s monitor also captured as a transfer event on April 6.
7. Key Takeaways
- Registration demand softened. 7.60M newly registered domains were found, a 2.7% decline from March’s 7.80M, and the active pool’s net gain decelerated from +2.07M to +1.67M. Non-active counts rose to roughly 6.77M (+4.3%).
- Developer-oriented TLDs grew faster than the market. .app (+4.90%), .bot (+4.06%), and .dev (+3.20%) all outpaced the overall pool growth of +0.68%.
- Registration profiles diverge sharply by TLD. Using .com and .org as baselines (12+ character names, 76-80% pure letters, 24% cloud/tech-stack), .top differs across every metric (7-character names, 20.9% pure letters, 99.3% single-year terms, 14% cloud/tech-stack), with no single cause identifiable from the data.
- Pending delete volume reached 5.13M unique domains. .com accounted for 63.3% of all pending deletes, and roughly 14.5% of deleted .com domains had been re-registered by early May.
- Premium .com monitor caught the month’s top sale. Nas.com appeared as a transfer event on April 6 before its $1.25M sale was publicly reported on April 17. Other notable movements included share.com now on GoDaddy (left Amazon infrastructure), use.com (reg. 1992) now listed for sale on Atom, and fbc.com now at brand-protection registrar MarkMonitor.
Methodology: Data covers 1,000+ gTLDs from multiple independent public sources and may differ from official registry figures. Sections 1-3 and Section 4 use different source pipelines; their totals should not be expected to reconcile. Sales data from publicly reported transactions. Full daily data at DomainKits.
*Non-active: counted once on the day a domain disappears from the zone file.
**Cloud/Modern Tech Stack and For-Sale: estimated by nameserver matching against known providers (Cloudflare, AWS, Vercel, Wix, Shopify, etc.) and sale platforms (Afternic, Sedo, Atom, etc.). Actual usage rates are higher than reported. This bias is amplified for developer-oriented TLDs (.dev, .app).
***Premium domain monitor pool: all 3-character .com domains, single dictionary-word .com domains, and curated keyword combinations.
****Keyword extraction uses dksplit (open-source segmentation) for word-boundary detection, not substring matching.