Key findings: Weekly registrations of domains containing “agent” spiked to more than 3x their March 2025 baseline in early 2026, and were still running at roughly 1.7x by the end of the observation window. For-sale rates for AI keywords run 2x-5x above the market baseline. When OpenClaw rebranded on January 30, 2026, domain registrations spiked within hours. Due to the near-zero cost of action (~$10 per domain), many registrants track tech news, GitHub, and industry events closely and place bets immediately, making domain registration data a unique real-time reflection of market sentiment around emerging AI trends.
Why .com? Why Pure Alphabetic?
We chose .com for three reasons: price stability, historical depth, and sample size.
- Price stability. .com registration has cost roughly $10 for over two decades. The cost of action is uniform across the entire dataset. When registration price is stable, volume changes are less likely to be driven by pricing alone.
- Historical depth. .com has been the dominant TLD since the mid-1990s. Registrars, aftermarket platforms, and DNS infrastructure are all built around it. The behavioral patterns we observe (for-sale NS configuration, registrar concentration, DNS migration) are well-established and interpretable.
- Sample size. 38.6 million registrations in our observation window. This provides the statistical power needed for weekly breakdowns and keyword-level analysis.
We further restrict to pure alphabetic domains (no digits, no hyphens). This filters out bulk-generated domains and IDN artifacts, giving us a cleaner signal of intentional, keyword-driven registrations.
1. The Baseline: .com Registration Market Overview
With the dataset defined, we establish what “normal” looks like across the 63-week period from March 2025 to May 2026. March 2025 also marks the launch of Manus, making it a meaningful starting point for the analysis.
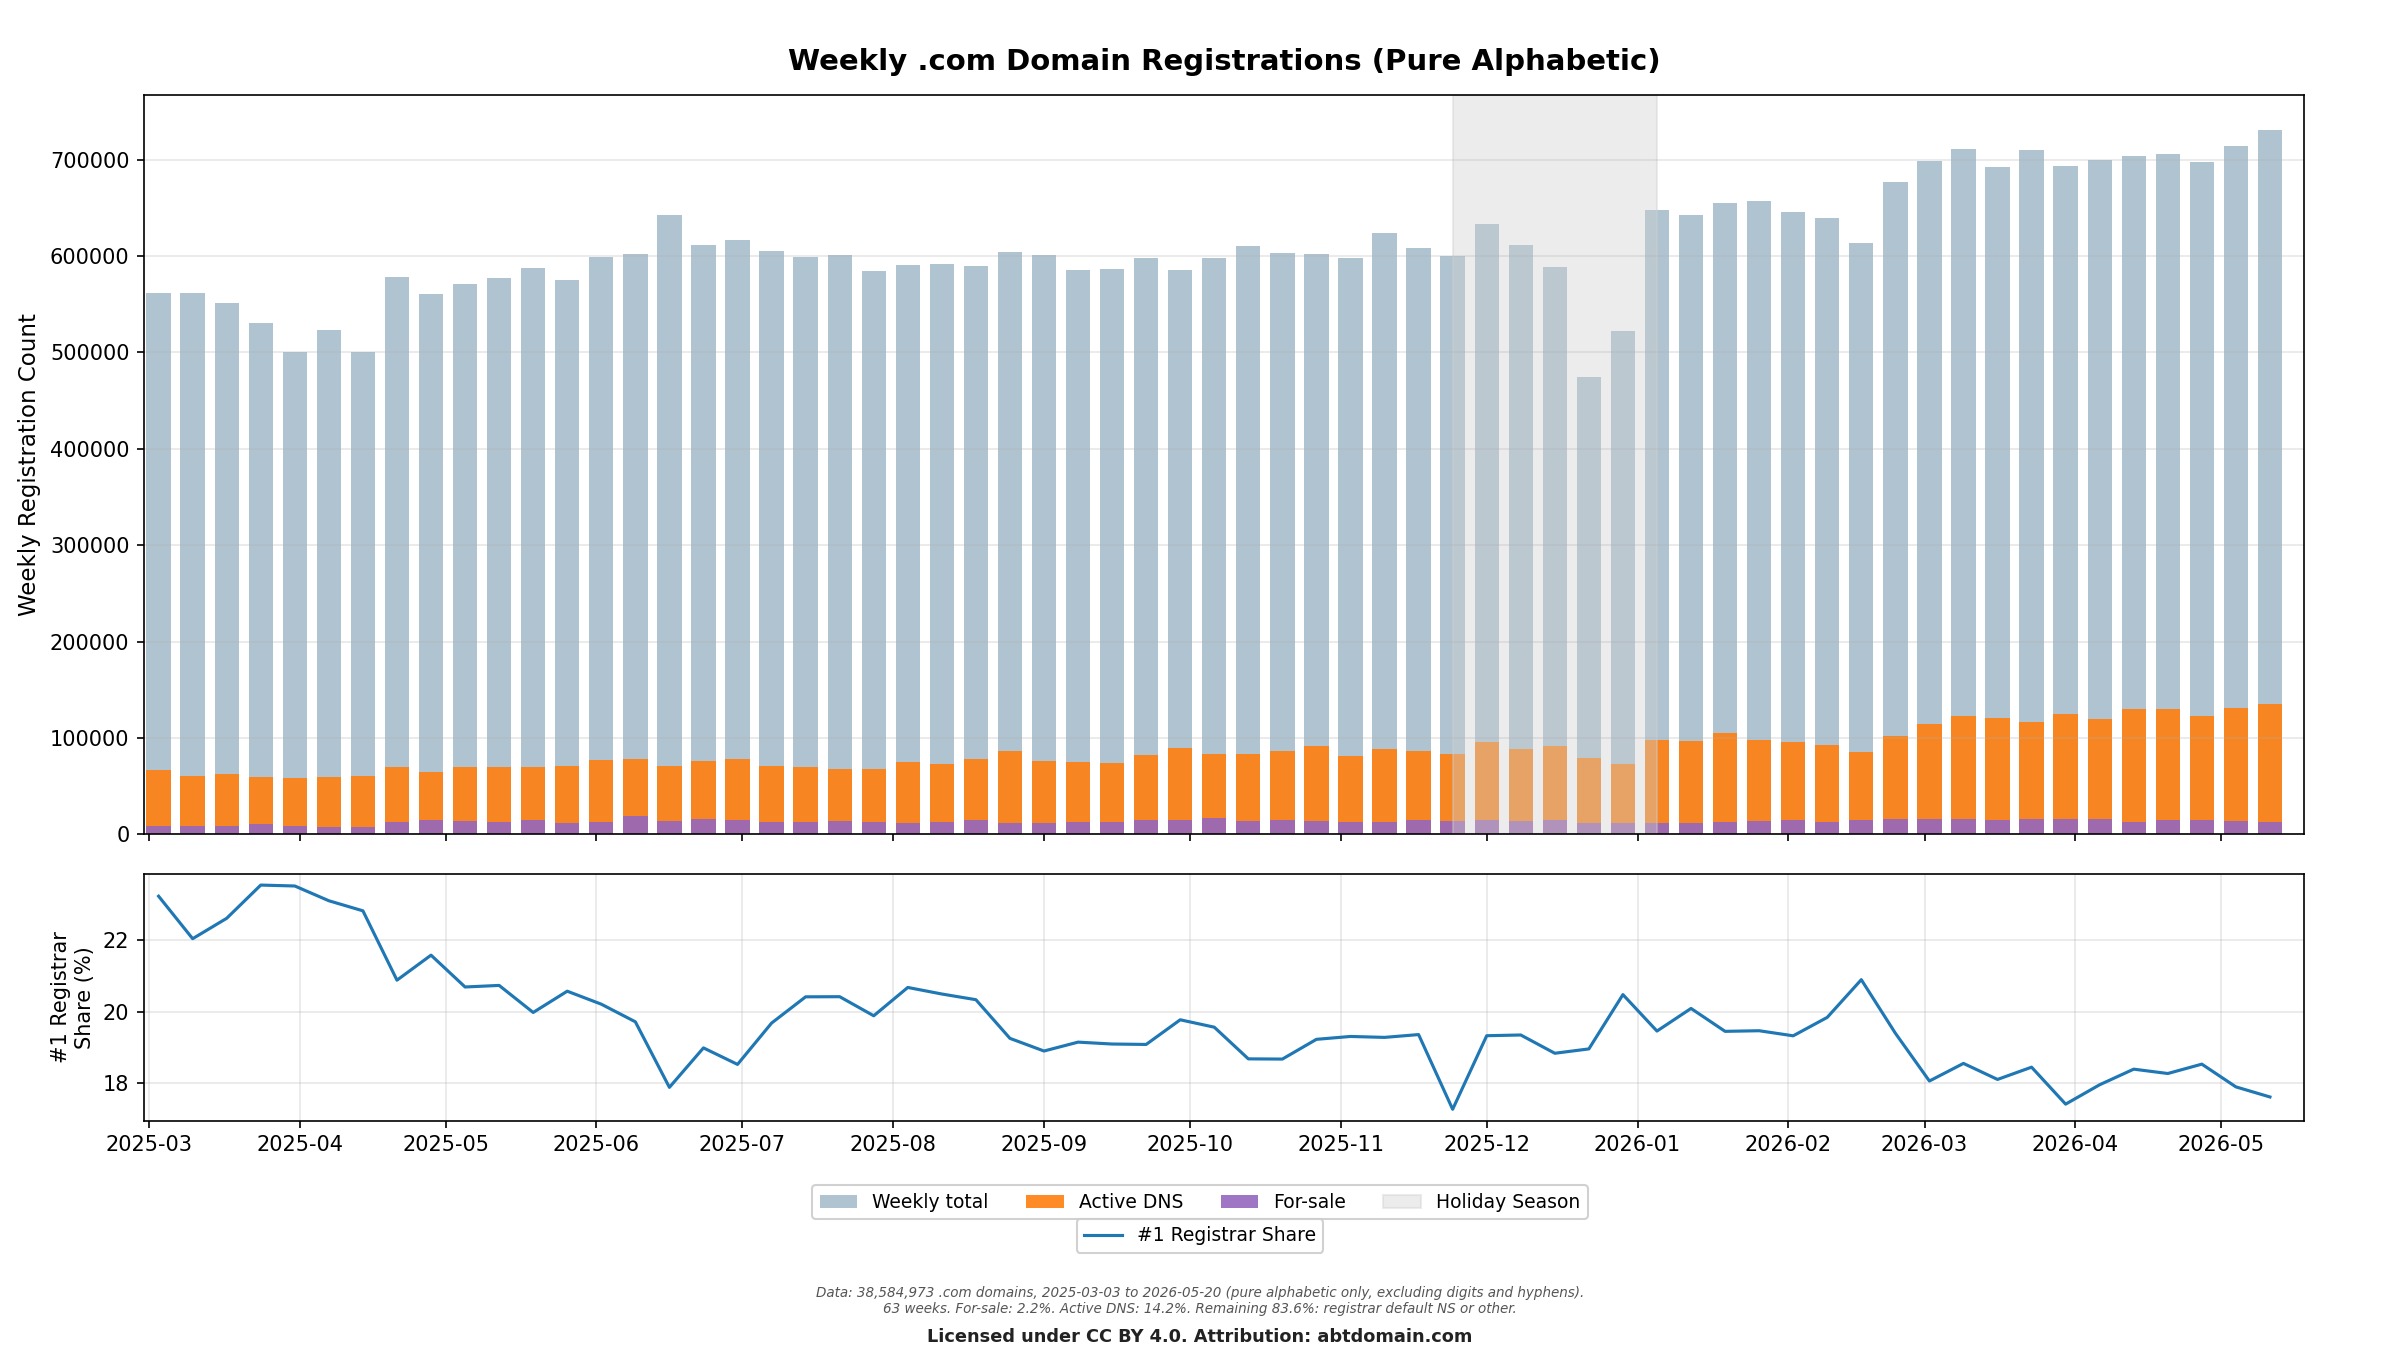
Several patterns are immediately visible:
- Steady growth. Weekly registration volume rose from approximately 550,000 in early 2025 to over 700,000 by mid-2026, representing roughly 30% year-over-year growth.
- Holiday dip and recovery. The Holiday Season (late November 2025 through early January 2026) shows a brief contraction, followed by a sharp rebound in January 2026.
- For-sale domains remain a small fraction. Domains pointing to known for-sale nameservers (sedoparking, afternic.com, atom.com) account for only 2.2% of total registrations. This is the market-wide baseline for speculative activity.
- Active DNS is growing. Domains using production-grade nameservers (AWS Route 53, Cloudflare, Vercel) account for 14.2% of registrations, and the proportion has been increasing steadily, particularly in 2026.
- #1 Registrar Share is stable at ~20%. The lower panel shows the market share of the top registrar each week. It hovers around 18-23% throughout the entire period, with a slight downward trend. This stability tells us the registrar market structure itself is not changing dramatically.
| Week of Mar 3, 2025 | Week of Mar 2, 2026 | |
|---|---|---|
| Total registrations | 562,161 | 698,349 |
| For-sale domains | 8,804 (1.6%) | 16,460 (2.4%) |
| Active DNS domains | 66,893 (11.9%) | 114,279 (16.4%) |
Why this matters: These baseline numbers (2.2% for-sale, 14.2% active, ~20% top registrar share) give us a reference point. When we look at AI-related keywords next, any deviation from these baselines is a signal worth investigating.
2. AI Keywords: Tracking the Signal
With the baseline established, we turn to the question that prompted this analysis: how has the AI wave affected domain registration behavior?
We extracted keywords from each domain using hybrid segmentation (DKSplit), and tracked two core AI-related keywords (“ai” and “agent”) alongside a baseline pattern (domains starting with “my”, a consistently popular registration pattern unrelated to any technology trend).
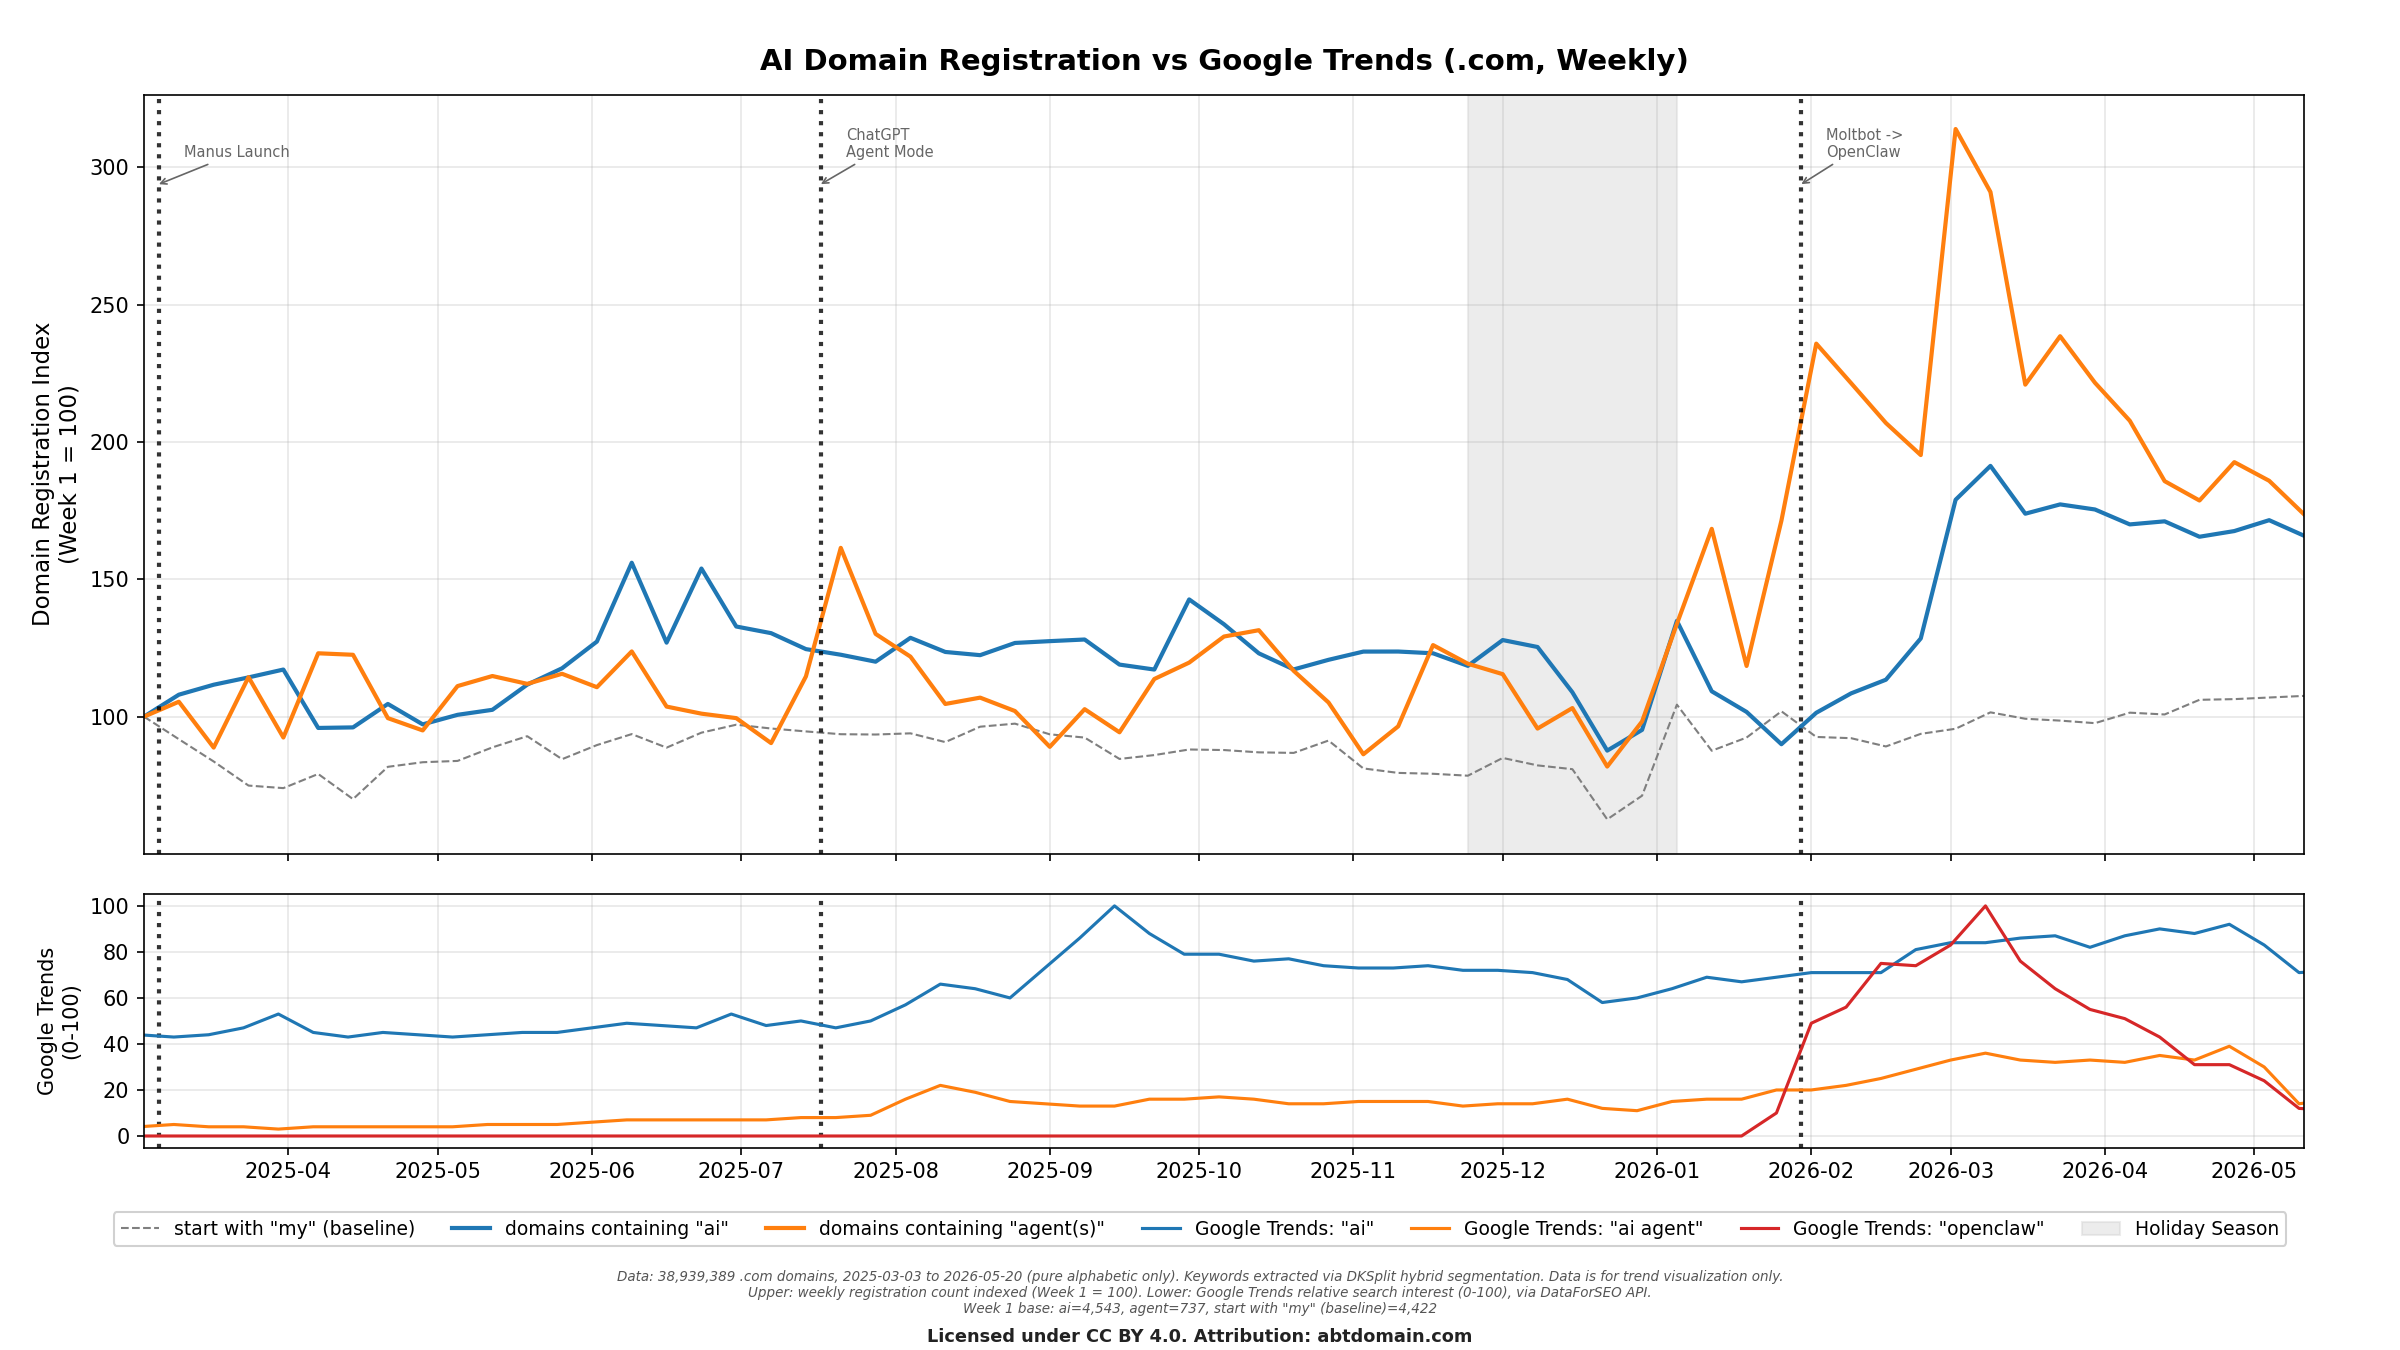
The upper panel uses an indexed view (Week 1 = 100) to make trends comparable regardless of absolute volume. The results are striking:
- The “my” baseline is flat. Domains starting with “my” (a perennial favorite for personal brands and projects) show almost no growth throughout the entire period. This confirms that the growth we see in AI keywords is not simply a rising tide lifting all boats.
- “ai” domains show sustained growth, holding a modestly elevated band through 2025 before climbing steeply in early 2026 to a peak of roughly 1.9x in March, and ending the window about 70% above baseline.
- “agent” domains show two distinct responses: a transient spike around the ChatGPT Agent Mode launch (July 2025) that decayed within weeks, and a sustained level shift beginning in mid-January 2026 alongside the Clawdbot/OpenClaw viral cycle and the broader agent product wave. The index peaks above 300 in early March 2026 — 3x the first observation week — before settling near 1.7x.
The lower panel overlays Google Trends data for “ai” and “ai agent”. Note the difference in timing rather than magnitude: search interest in “ai” roughly doubled from the start of the window to its September 2025 peak and then plateaued, while “ai” registrations ended the window about 70% above their March 2025 level, with nearly all of that gain concentrated in early 2026. The two instruments grew by comparable amounts but on different clocks: search tracked broad public attention through 2025, whereas registrations moved when the agent wave gave that attention something concrete to bet on.
A Closer Look at the Numbers
Beyond the indexed trends, the absolute registration volumes and DNS distribution reveal the composition of this market.
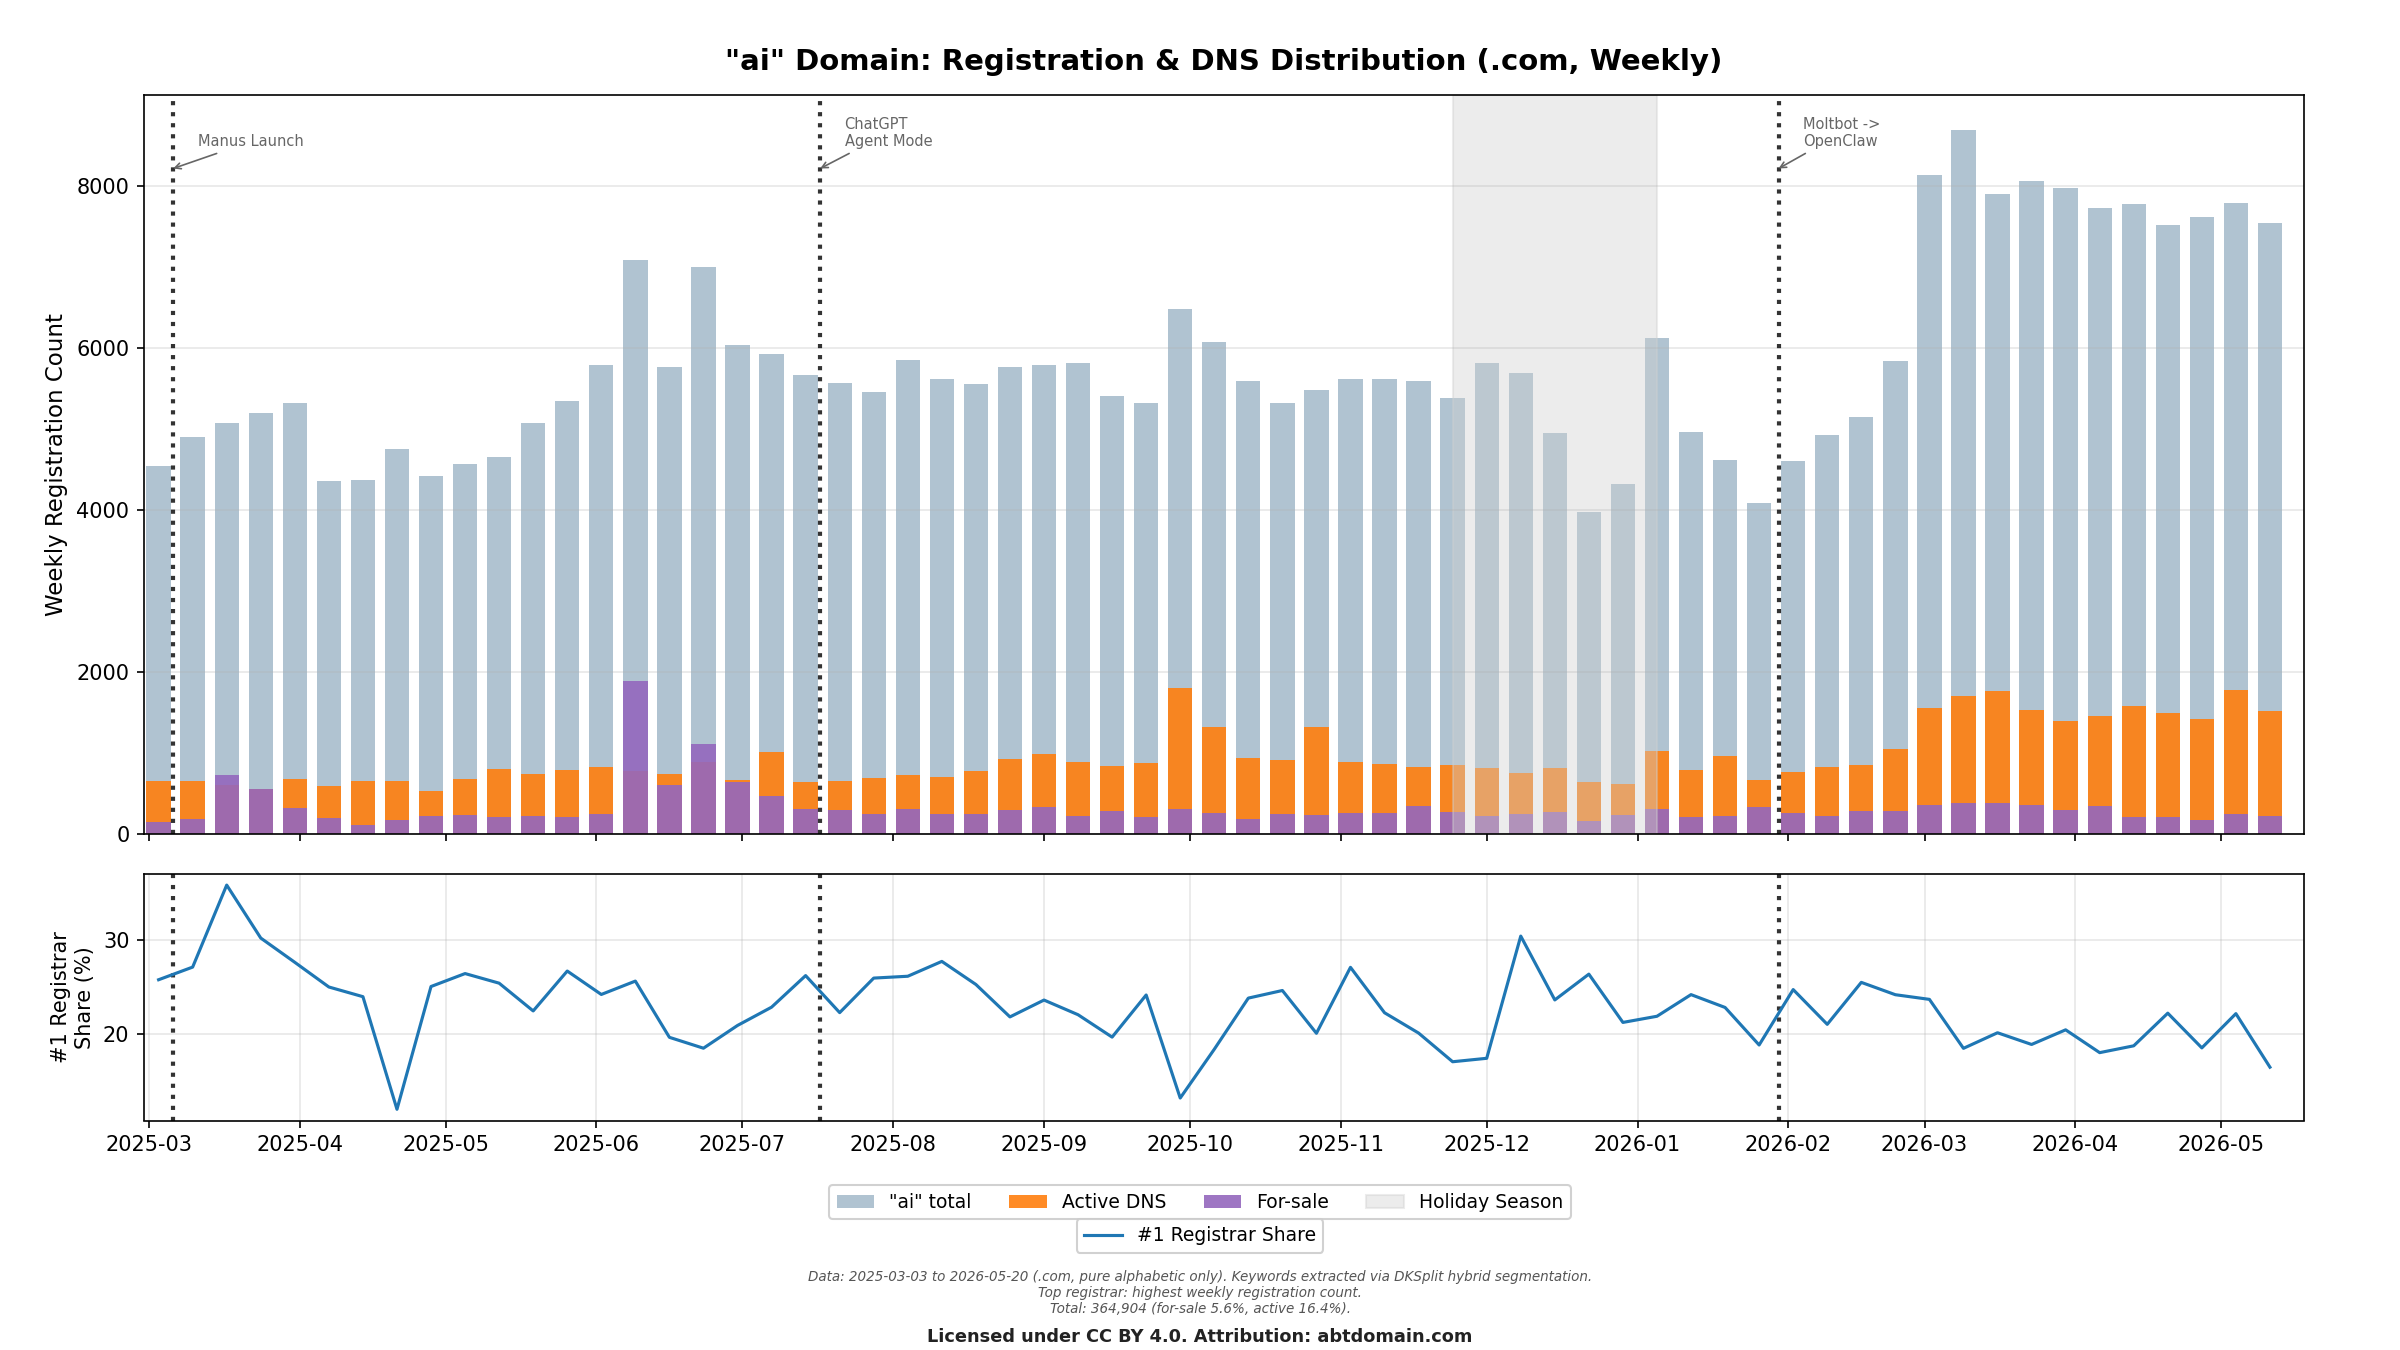
For domains containing “ai” (approximately 365,000 total over the observation period):
- For-sale rate: 5.6%, more than double the 2.2% market baseline.
- Active DNS rate: 16.4%, slightly above the 14.2% baseline.
- #1 Registrar Share fluctuates around 25-30%, notably higher than the ~20% market baseline, suggesting more concentrated registration behavior.
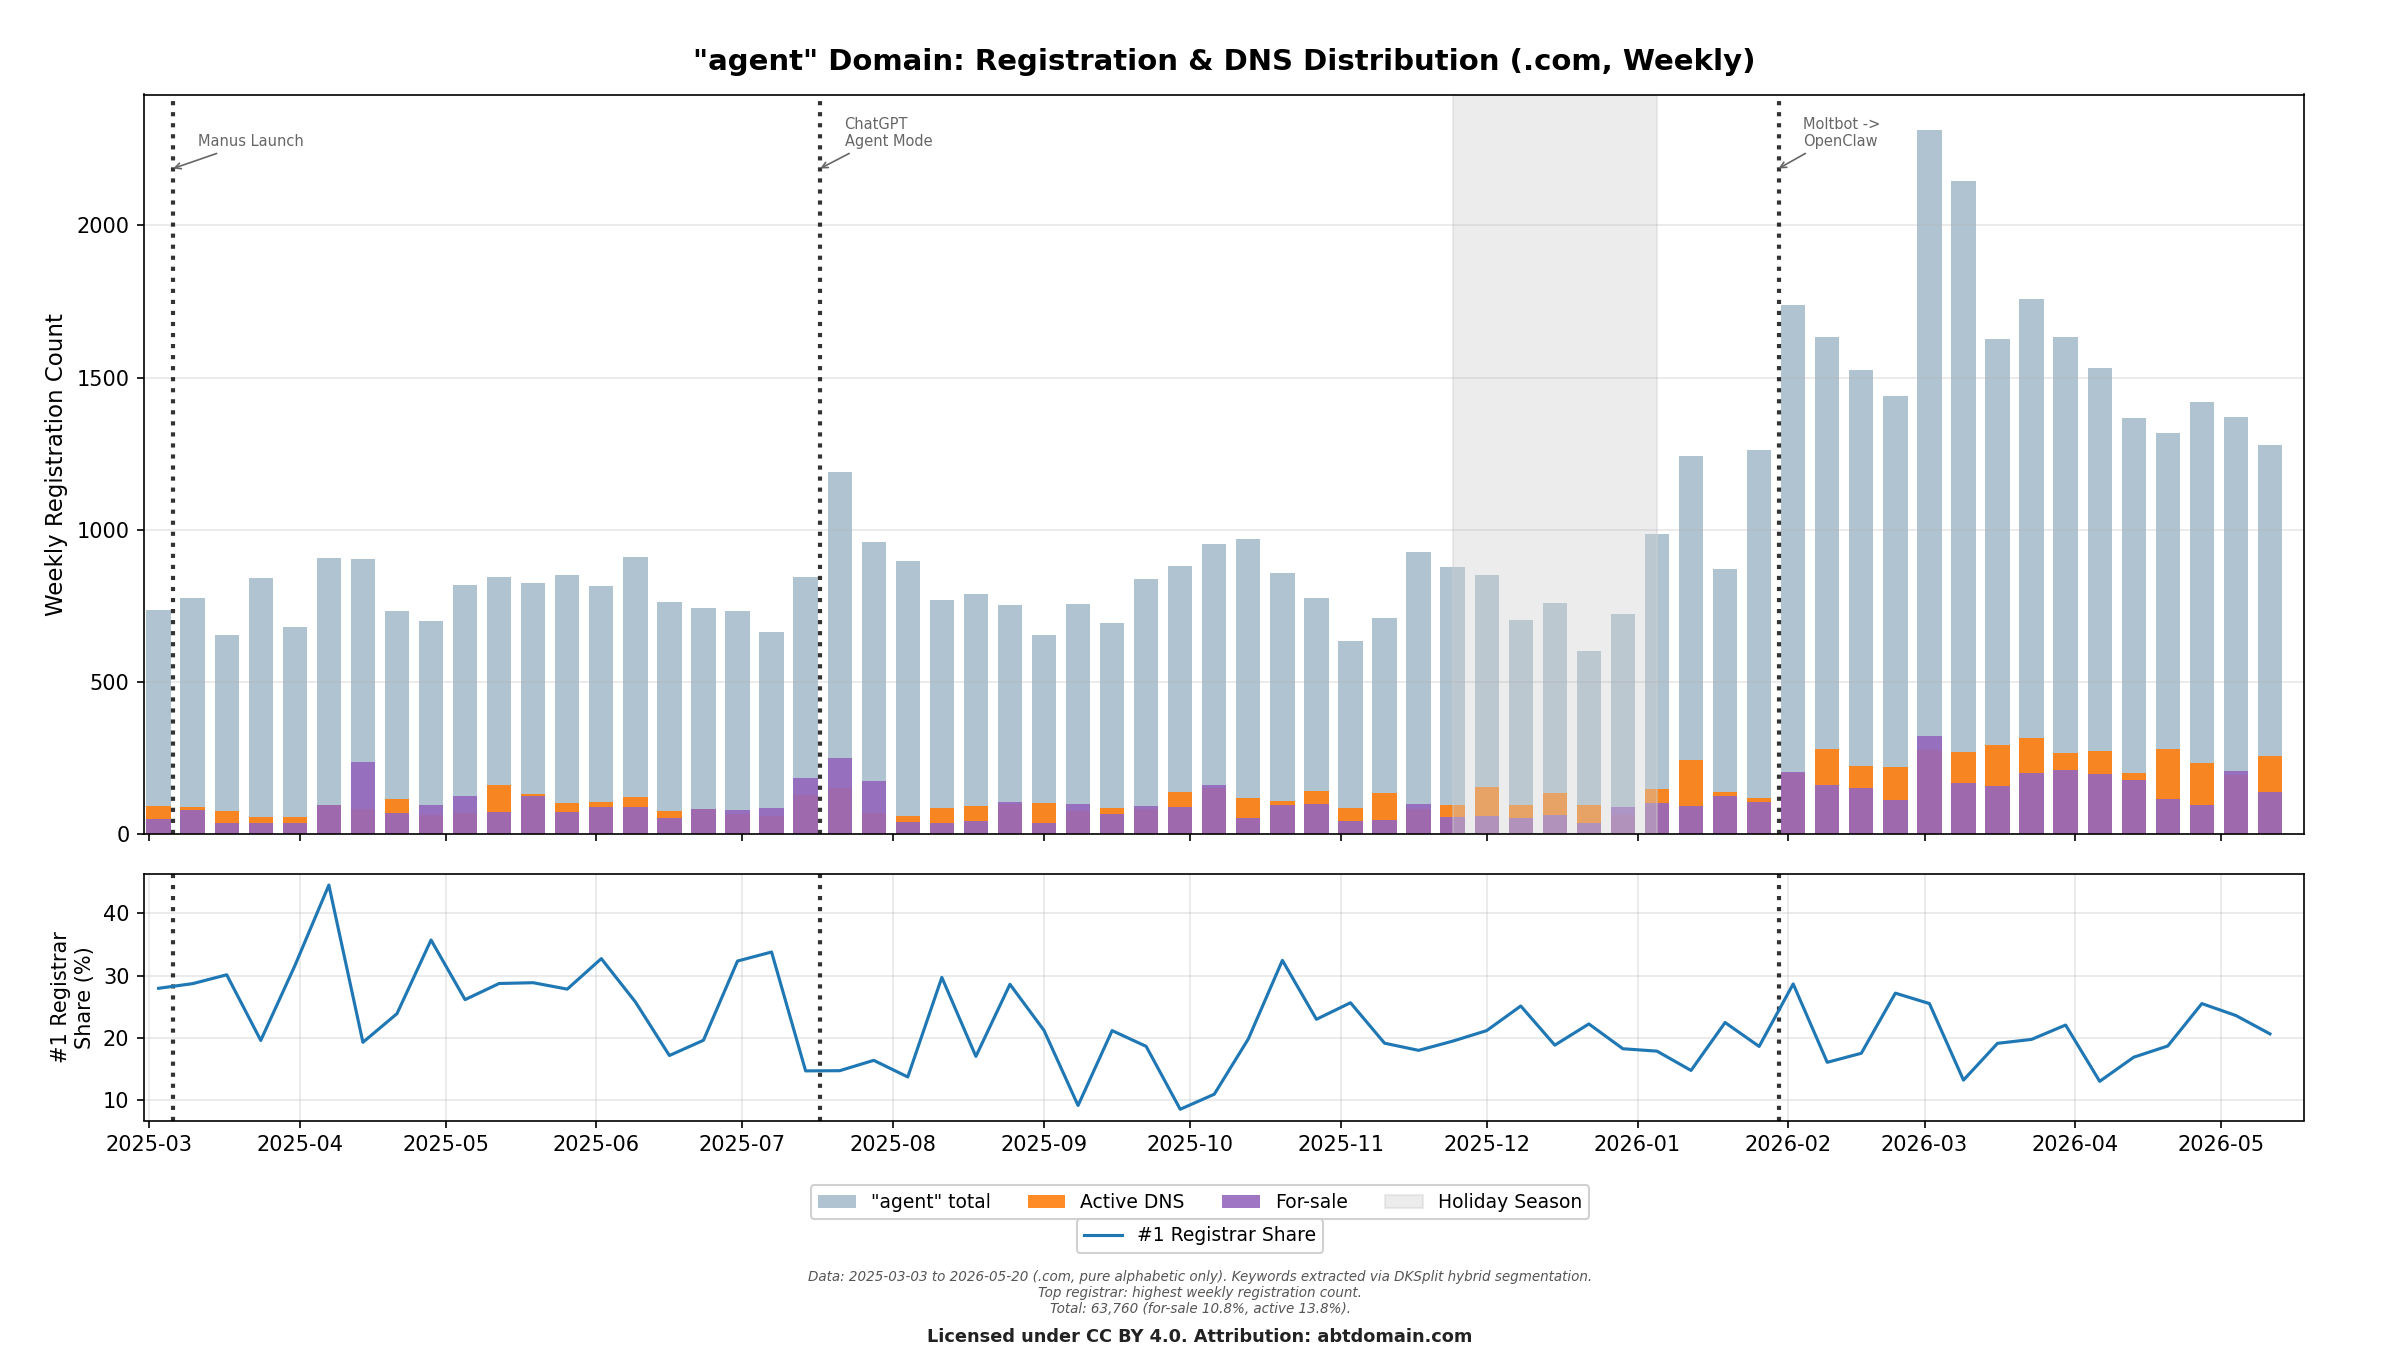
For domains containing “agent” (approximately 64,000 total):
- For-sale rate: 10.8%, nearly 5x the market baseline.
- Active DNS rate: 13.8%, close to the baseline.
- #1 Registrar Share shows significant spikes (sometimes exceeding 40%), indicating that certain weeks were dominated by a single registrar’s customers, a pattern consistent with organized speculative registration.
Key finding: The more specific and “trendy” the keyword, the higher the speculative signal. “ai” (broad, established) has a for-sale rate of 5.6%. “agent” (narrower, trending) has 10.8%. Both are well above the 2.2% market baseline. Meanwhile, active DNS rates remain close to normal, suggesting that the surge is not accompanied by a proportional increase in immediately deployed infrastructure.
3. Case Study: The OpenClaw Phenomenon
If the aggregate data shows a gradual rise in AI-related domain speculation, the OpenClaw story provides a real-time case study of how this works in practice.
The project started as ClawdBot, an open-source AI agent framework. After receiving a trademark complaint from Anthropic (maker of Claude), the team rebranded to Moltbot. That name did not stick either. On January 30, 2026, the project settled on its final identity: OpenClaw, with ClawHub as its companion plugin marketplace. What happened next in the domain market is a textbook example of speculative positioning.
Three distinct phases are visible:
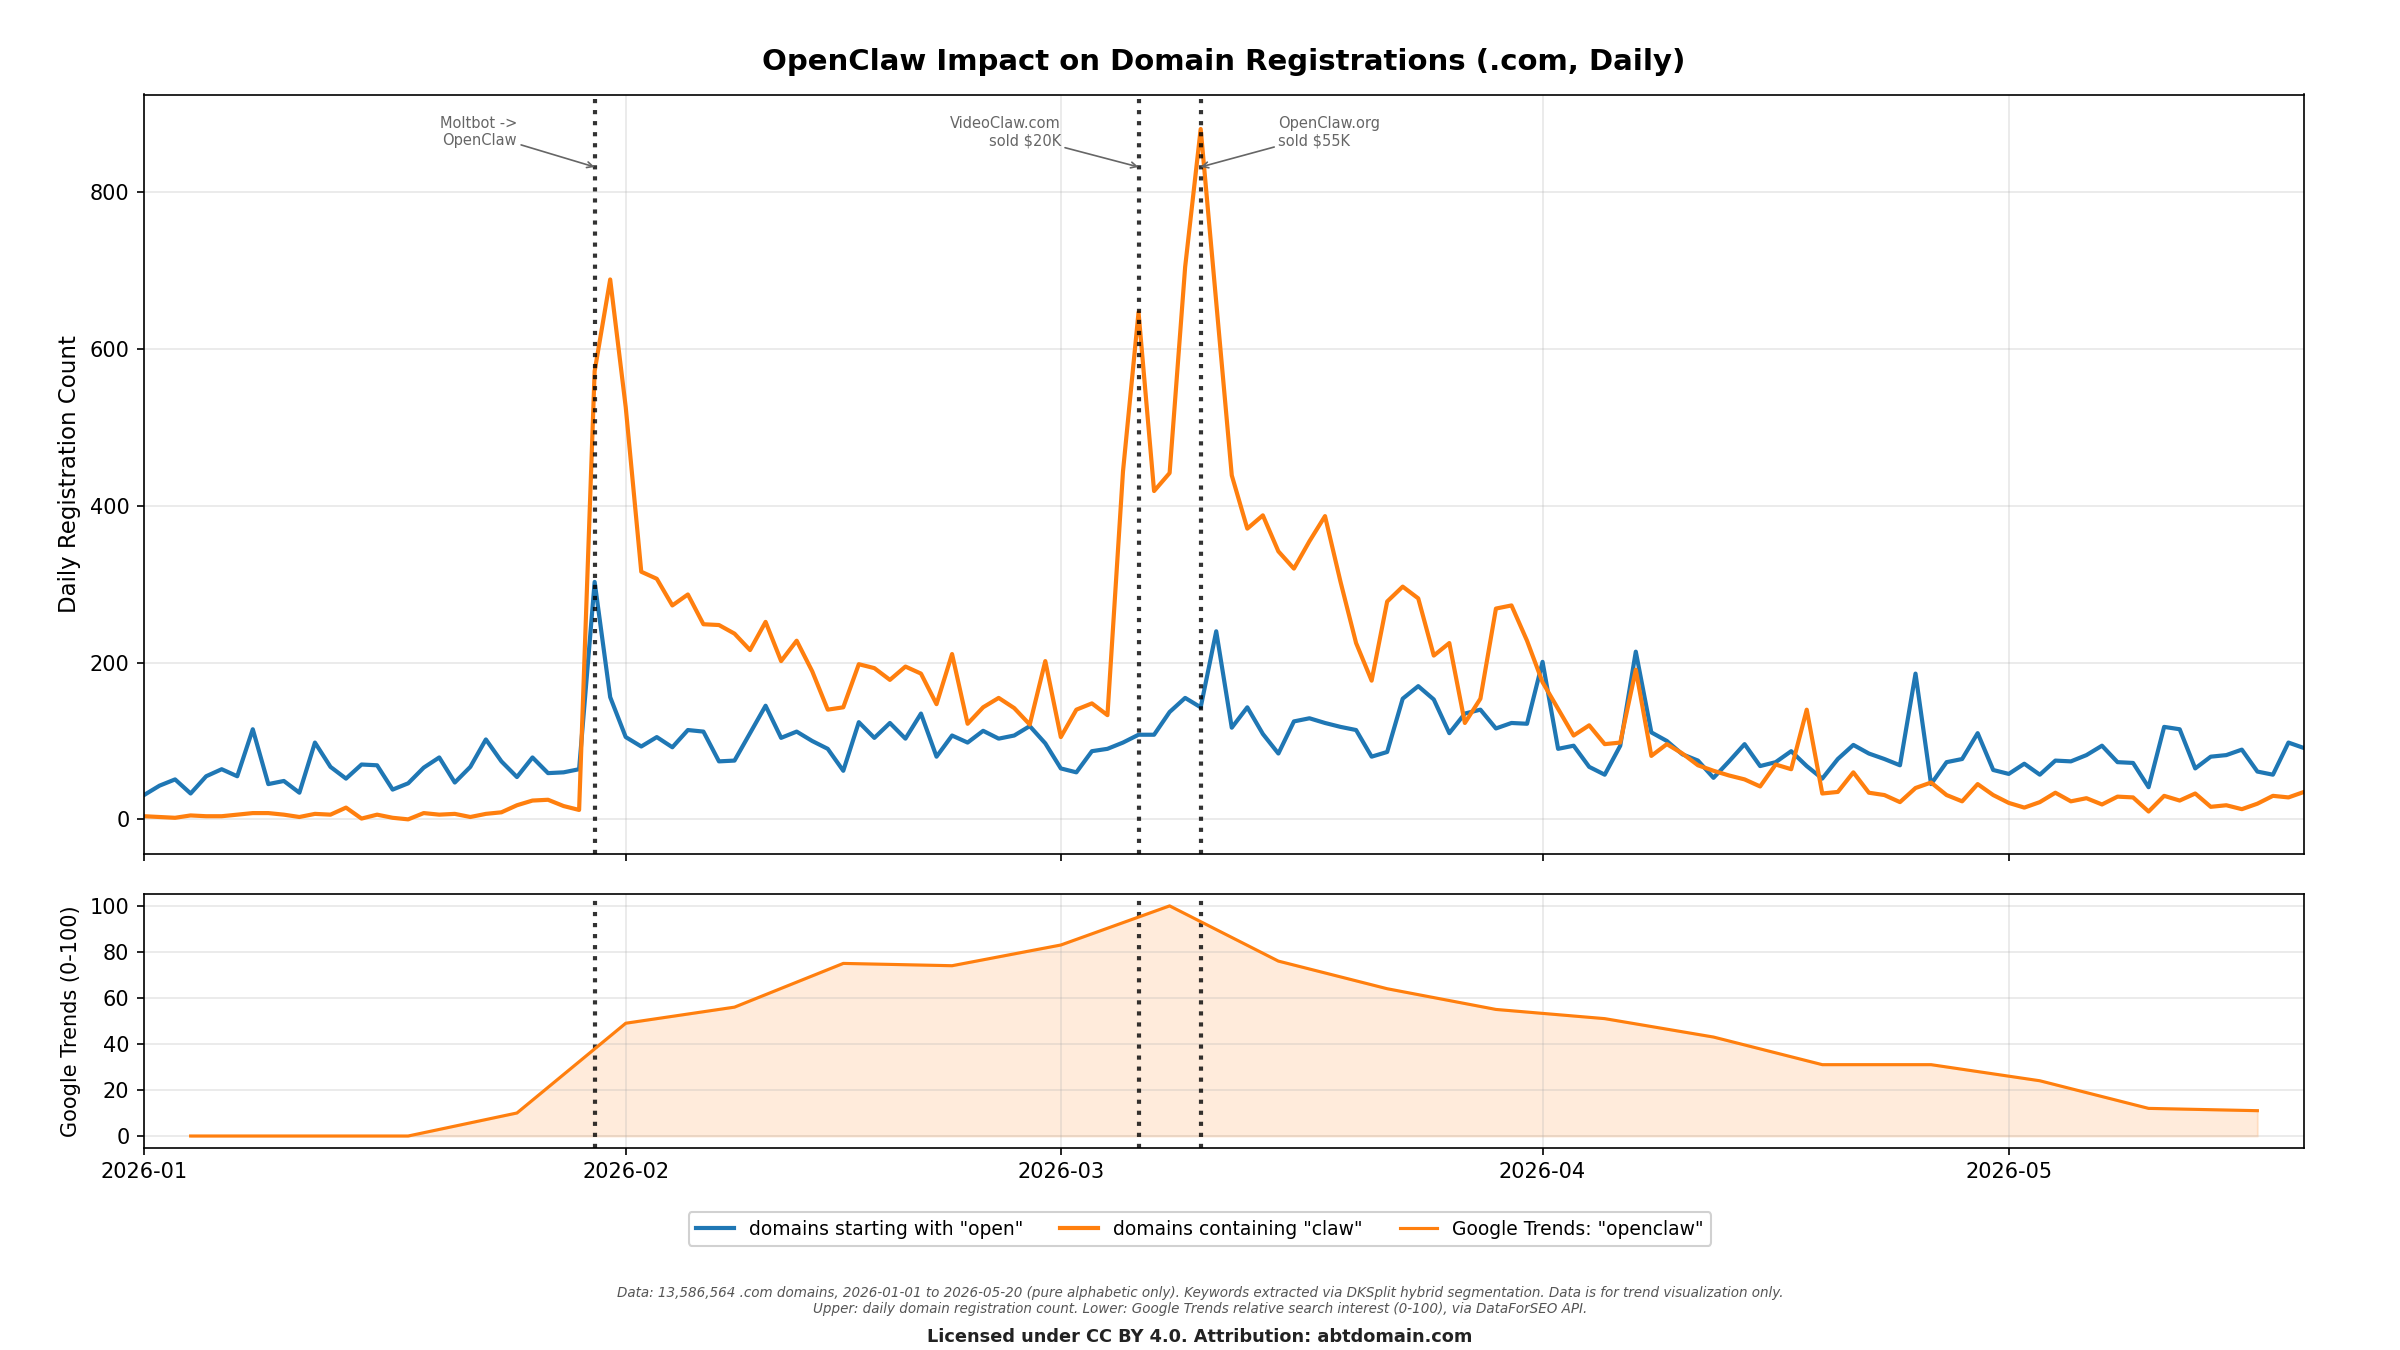
- Phase 1: The Initial Rush (Jan 30 – Feb 10). Within hours of the rebrand announcement, “claw” domain registrations exploded from near-zero to hundreds per day. Domains starting with “open” spiked simultaneously. This is pure speculative positioning: registrants are betting that OpenClaw-related domains will become valuable.
- Phase 2: The Aftermarket Signal (Mar 6 – Mar 10). Two domain sales made headlines: VideoClaw.com sold for $20K (March 6) and OpenClaw.org sold for $55K (March 10). Each sale triggered a secondary registration wave, as new speculators entered the market hoping to replicate the success.
- Phase 3: The Long Tail (April onwards). Registration volume gradually declines but remains elevated above pre-event levels. The market has priced in the opportunity and moved on to scanning for the next signal.
The Google Trends line (lower panel) provides an important contrast. Public search interest in “openclaw” only begins rising days after the domain registration spike. By the time the general public is searching for information, domain speculators have already acted.
The DNS Tells the Story
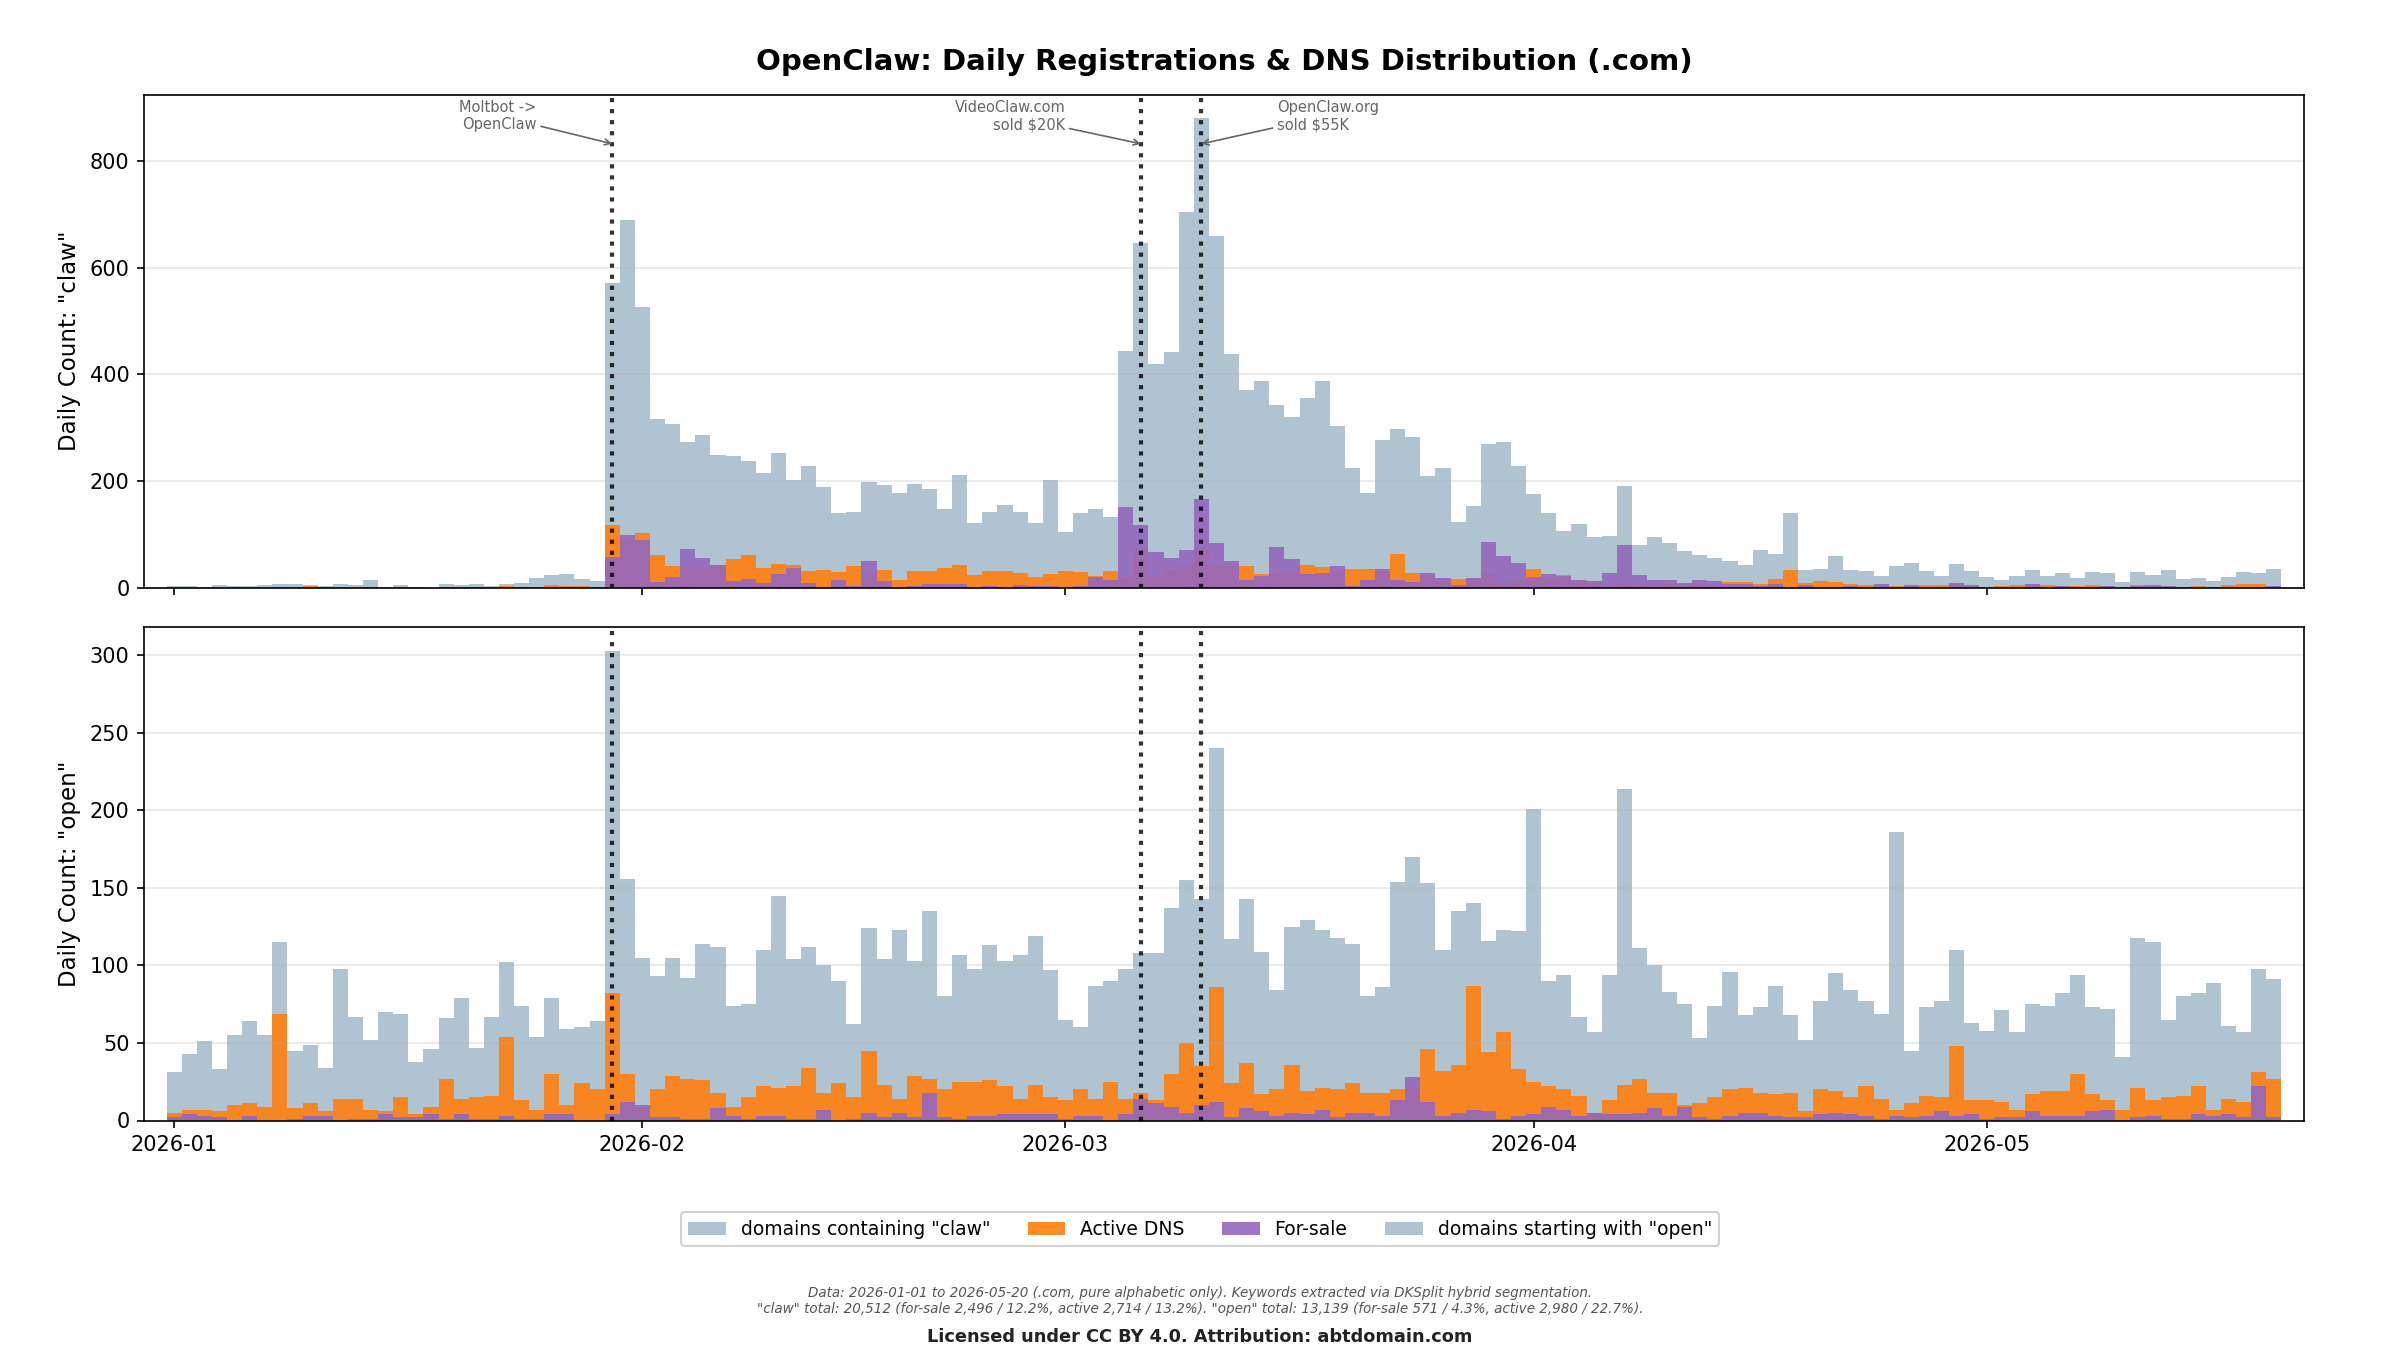
The DNS distribution during the OpenClaw event reveals the intent behind these registrations:
- “claw” domains: 11.6% for-sale, 13.1% active. The for-sale rate is 5.3x the market baseline. On peak registration days, the purple for-sale bars are clearly visible, confirming that a significant portion of registrants immediately set up their domains for resale.
- “open” domains: 3.5% for-sale, 22.8% active. The “open” prefix has a much higher active DNS rate (22.8% vs 14.2% baseline) and a lower for-sale rate, consistent with its widespread use as a general-purpose prefix (opensource, opendata, etc.).
The contrast between these two patterns is telling. “claw” is a keyword that had virtually no domain registration activity before OpenClaw. Its elevated for-sale rate of 11.6% strongly suggests that much of the activity came from speculators responding to a single event. “open”, by contrast, is a pre-existing pattern with genuine organic demand.
Impact Beyond “claw”
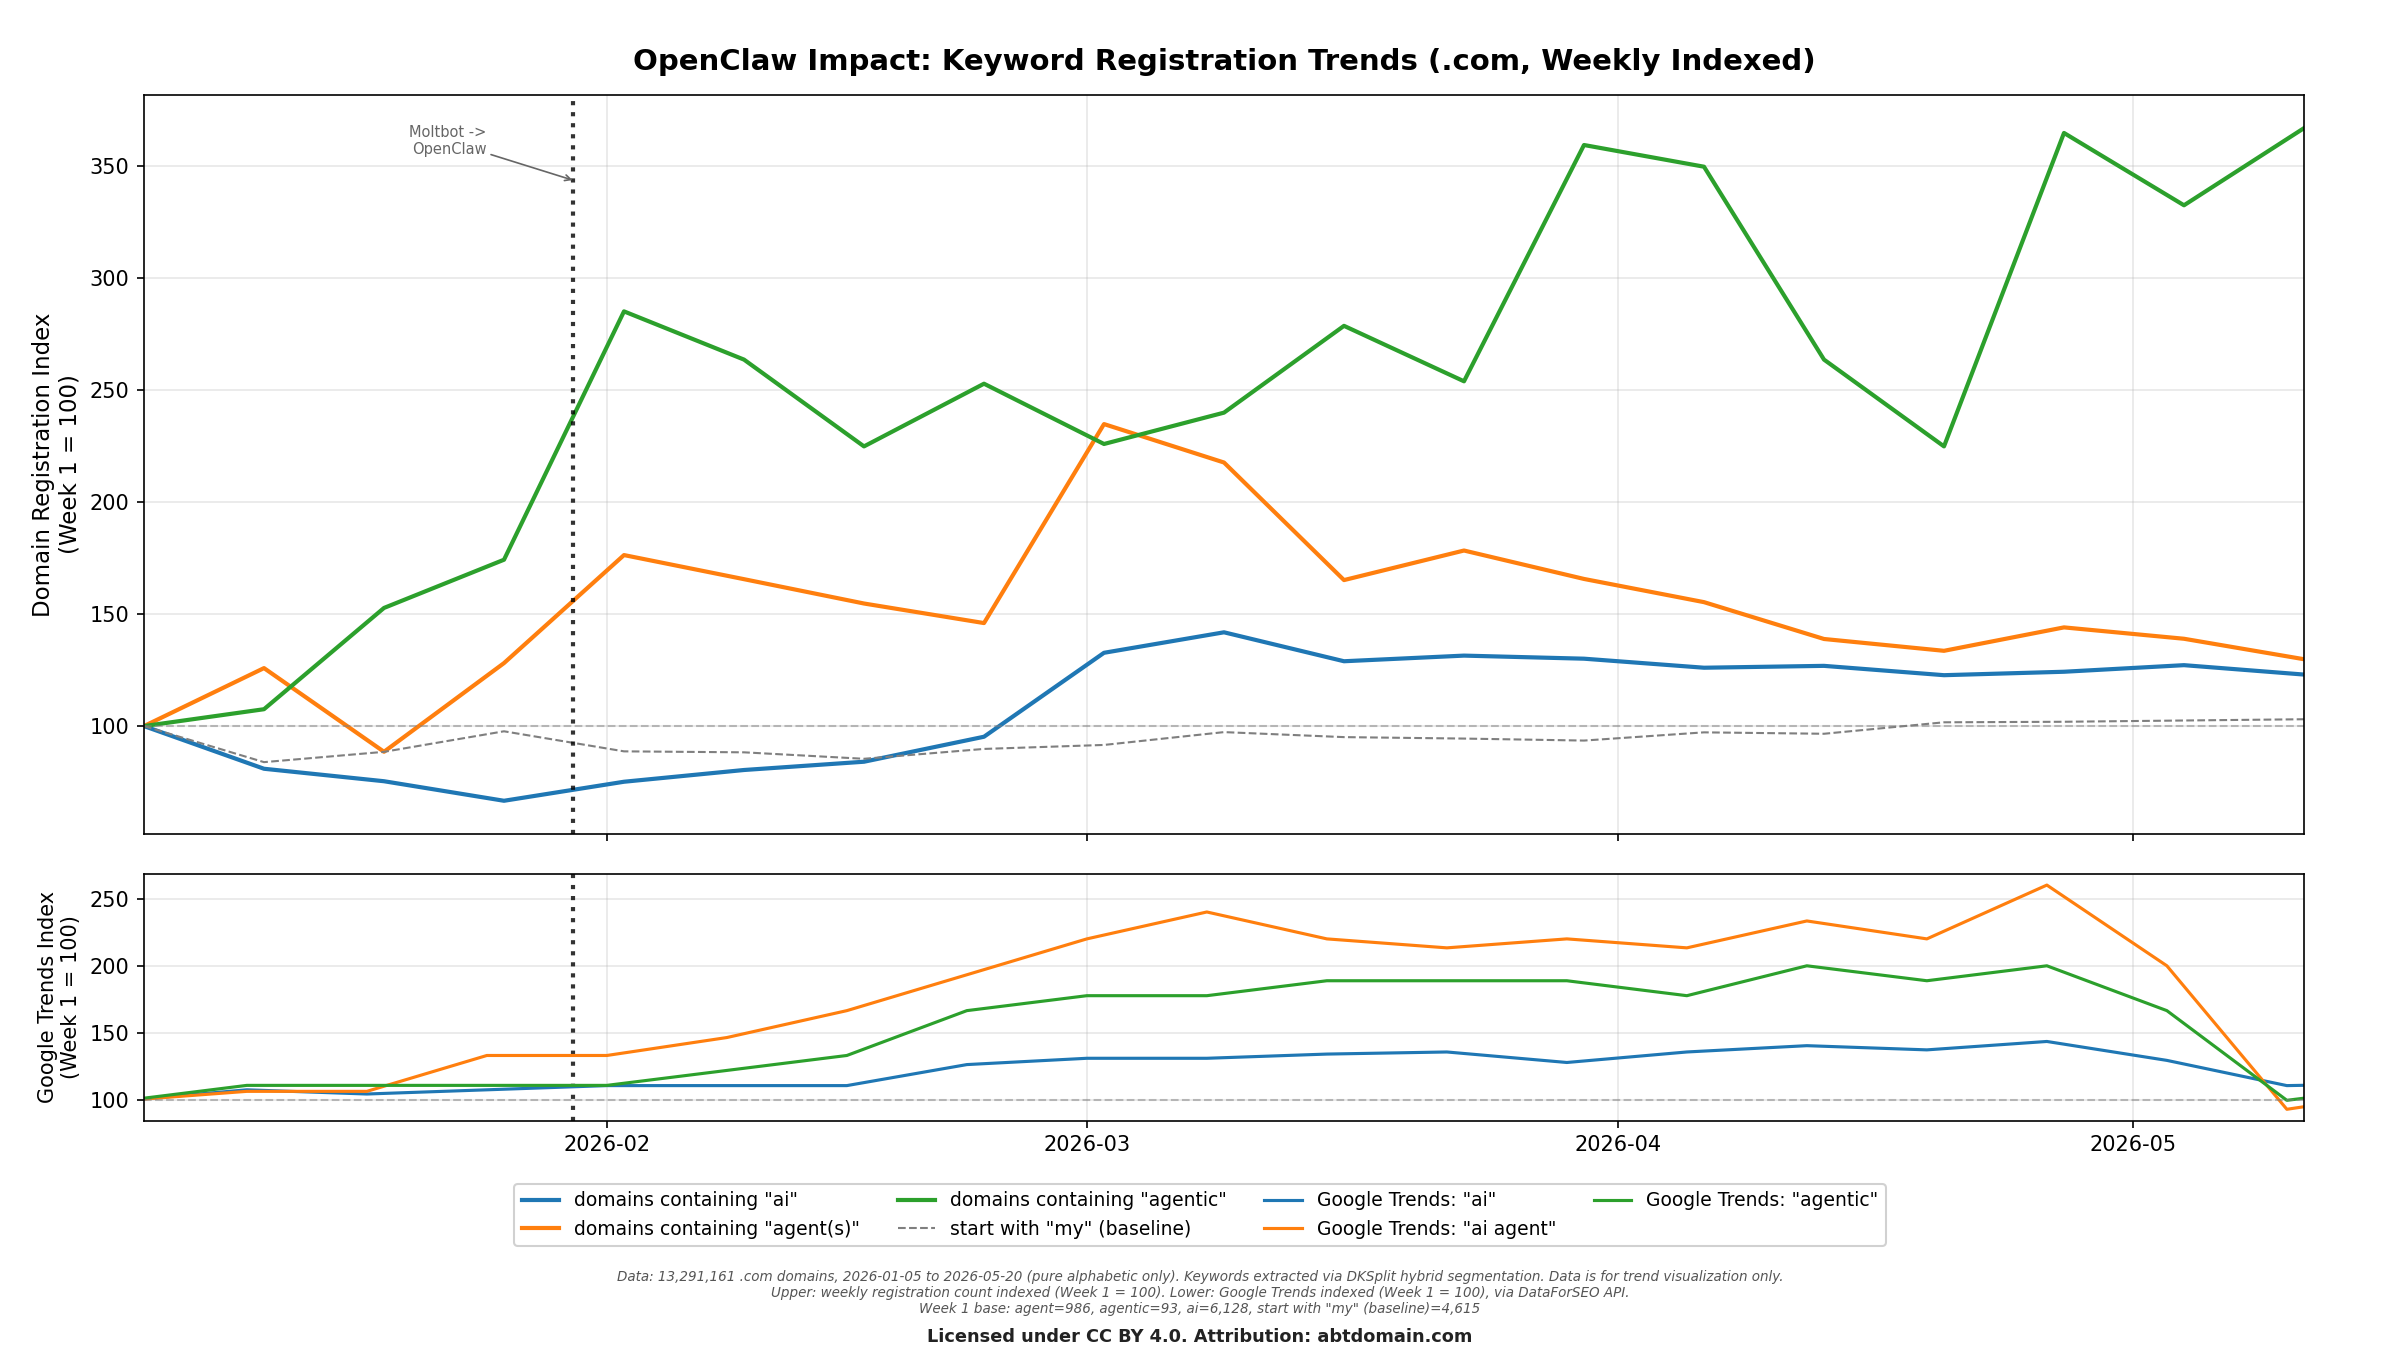
The OpenClaw event did not occur in isolation. Figure 7 shows that the “agent” keyword (green line) experienced its most significant growth phase in early 2026, coinciding with OpenClaw and a broader wave of agent-related product launches. The “agentic” keyword also spiked, while the “my” baseline remained flat.
This confirms that 2026 has been, in domain registration terms, the year of the AI agent. The narrative has shifted from generic “AI” to more specific concepts like agents, automation, and platform-specific terminology.
4. Outlook: Domains as a Leading Indicator
Registering a domain is typically the first step in any internet project. At ~$10 and 30 seconds, the barrier is near zero. Some registrants go on to build products, others are betting on the growth of a keyword. Either way, a domain registration represents a commitment of attention and resources to a specific direction. That makes aggregate registration data a useful signal for where the market is heading.
Google Trends data is included in several charts as a reference overlay. It provides context on public search interest around the same keywords, but it measures a fundamentally different population and should not be compared directly with domain registration volumes.
What to watch: As AI continues to evolve, domain registration patterns around new keywords, brands, and concepts will continue to reflect how the most active participants in the market interpret emerging trends. Whether tracking “claw” after a rebrand or “agent” after a product launch, domain registration data provides a real-time window into market sentiment that complements, rather than competes with, other signals like search interest.
This is not a prediction of which domains will be valuable. Most speculative registrations will expire unused. But as a reflection of where market attention is flowing, the signal is consistent and observable.
Data Sources & Methodology
- Domain data. Newly Registered Domain Strings database (domainkits.com/download/nrds). All domain attributes (NS, registrar, etc.) are snapshots captured within 24-48 hours of registration.
- Keyword extraction. DKSplit as the base segmentation engine, combined with multiple supplementary tool flows for hybrid segmentation.
- Google Trends. DataForSEO API, relative search interest on a 0-100 scale.
- Top registrar. WHOIS registrar field.
- DNS classification. We use a few representative nameservers as trend indicators. For-sale: sedoparking, afternic.com, atom.com. Active DNS: awsdns, cloudflare, vercel. In a dataset of 38.6 million domains across an open market, the share of any given NS provider tends to be stable over time, making deviations from baseline meaningful. These are not exhaustive classifications.
- Limitations. This is a trend study, not a precise measurement. Domain keyword segmentation has inherent ambiguity. Google Trends values are not comparable across different queries. The dataset covers .com only and pure alphabetic domains only. These constraints do not affect directional conclusions.
For methodology details on interpreting domain registration distributions, see: How to Read Domain Registration Trends Like a Market.
Domain data and analysis tools: abtdomain.com. All charts are licensed under CC BY 4.0. Attribution required.